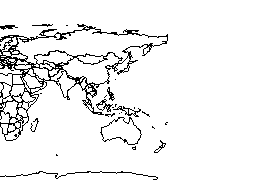
Region Selected:
Lower Left Latitude/Longitude: 10 N°, 146.4 E°
Upper Right Latitude/Longitude: 22 N°, 158.4 E°
| Overview Map |
Loading Map Images

A Map Service error occurred: some layers may not be displayed.
The Map Service is temporarily unavailable.
 Projection: Web Mercator

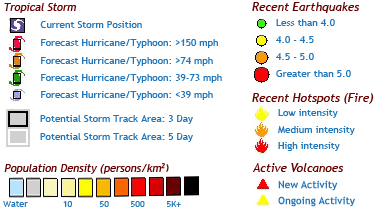
 Legend

Hazards
Current Hazards
Recent Earthquakes (Past 7 Days)
| Date(UTC) |
Magnitude |
Depth(Km) |
Region |
Lat/Long |
| None found for the area chosen. |
|
|
|
|
Active Tropical Storms (Current and 3-day Forecast Positions)
| Name |
Advisory Date(UTC) |
Wind Speed |
Wind Gusts |
Heading |
Track Speed |
Status |
Pressure |
Lat / Long |
| HIGOS |
11-Feb-2015 |
29.0 |
40.0 |
NW |
7.0 |
Tropical Depression |
mb |
16 N / 152.4 E |
Active Volcanoes
| Name |
Region |
Activity |
Primary Observatory |
More Information |
Last Updated |
Lat/Long |
| None found for the area chosen. |
|
|
|
|
|
|
Recent Hotspots (Fire)
| Date of First Obs(UTC) |
Date of Last Obs(UTC) |
Description |
Mean Lat. |
Mean Long. |
| None found for the area chosen. |
|
|
|
|
Historical Hazards
Historical Earthquakes
(Resulting in significant damage or deaths)
Last 50 Years
5 Most Recent Earthquakes
| Date(UTC) |
Magnitude |
Depth(Km) |
Intensity |
Deaths |
Location |
Lat / Long |
| Apr 05 1990 00:21 |
7.5 |
11 |
4 |
0 |
GUAM; NORTHERN MARIANA ISLANDS: SAIPAN |
15.13° N / 147.6° E |
5 Largest Earthquakes
| Date(UTC) |
Magnitude |
Depth(Km) |
Intensity |
Deaths |
Location |
Lat / Long |
| Apr 05 1990 00:21 |
7.5 |
11 |
4 |
0 |
GUAM; NORTHERN MARIANA ISLANDS: SAIPAN |
15.13° N / 147.6° E |
Volcanic Eruptions
Note: Historical eruptions data last updated in year 2000.
Last 100 Years Eruptions
5 Most Recent Eruptions
| Name |
Date(UTC) |
Magnitude |
Location |
Lat / Long |
| None found for the area chosen. |
|
|
|
|
Tsunami Runups
Note: For each Tsunami event, there may be many locations of recorded runups of the same date for the chosen area.
To avoid duplicate results, the Regional Reporter tool applies a filter to display only one result per tsunami event.
5 Most Recent Tsunami Runups
| Date(UTC) |
Country |
Location |
Runup(meters) |
Deaths |
Lat / Long |
| Mar 11 2011 10:00 |
USA TERRITORY |
D52402 BPR - 790 NM NW OF KWAJALEIN |
0.1 |
|
11.57° N / 154.59° E |
| Feb 27 2010 00:00 |
USA |
HILO, HAWAII, HI |
0.9 |
0 |
19.73° N / 155.07° E |
5 Largest Tsunami Runups
| Date(UTC) |
Country |
Location |
Runup(meters) |
Deaths |
Lat / Long |
| Feb 27 2010 00:00 |
USA |
HILO, HAWAII, HI |
0.9 |
0 |
19.73° N / 155.07° E |
| Mar 11 2011 10:00 |
USA TERRITORY |
D52402 BPR - 790 NM NW OF KWAJALEIN |
0.1 |
|
11.57° N / 154.59° E |
Large Wildfires
(Greater than 40 sq. km.)
| Start Date(UTC) |
End Date(UTC) |
Intensity |
Size (sq. km.) |
Mean Lat. |
Mean Long. |
| None found for the area chosen. |
|
|
|
|
|
Earthquake Intensity Zones
Probable maximum MMI intensity once in 50 years
| Maximum Zone |
| None found for the area chosen. |
Storm Intensity Zones
Wind Speed with a 10% chance of occurring within 10 years
| Maximum Zone (km/hr) |
| 250+ |
Demography
Population 2001
| Total Population |
Maximum Density (ppl/km2) |
| 0 |
0 |
Population 2002
| Total Population |
Maximum Density (ppl/km2) |
| 0 |
0 |
Population 2006
| Total Population |
Maximum Density (ppl/km2) |
| 0 |
0 |
Population 2007
| Total Population |
Maximum Density (ppl/km2) |
| 0 |
0 |
Countries
| Country |
| None found for the area chosen. |
Major Cities
| Country |
Name |
Population |
Status |
Lat / Long |
| None found for the area chosen. |
|
|
|
|
Infrastructure
Airports
| Name |
Type |
Elevation (Ft.) |
Link |
Lat / Long |
| None found for the area chosen. |
|
|
|
|
Nuclear Power Plants
| Name |
Country |
Number of Reactors |
Lat / Long |
| None found for the area chosen. |
|
|
|
Environment
Urban/Rural Mask (SEDAC)
| Land Cover |
Area (km2) |
% |
| Not classified |
1,712,118 |
100 |
MODIS IGBP Land Cover
(excluding water area)
| Land Cover |
Area (km2) |
% |
| None found for the area chosen. |
|
|
Elevation (meters)
(land only)
| Minimum |
Maximum |
Average |
| 0 |
0 |
0 |
Average Temperature (degrees C)
| |
Feb |
Mar |
Apr |
| low |
23.3 |
23.5 |
24.4 |
| high |
29.0 |
29.3 |
30.1 |
Average Precipitation
| |
Feb |
Mar |
Apr |
| mm/day |
8.4 |
7.4 |
9.9 |
Current Meteorological Observations (METAR)
| Station Name |
Observation Time (UTC) |
Temp (F) |
Wind Speed (MPH) |
Wind Direction |
Sky Condition |
Lat / Long |
| None found for the area chosen. |
|
|
|
|
|
|
End.


